Field ops · 2025
Palm Oil Platform
A multi-tenant estate management platform for oil palm, deployed across 8 estate companies in 4 countries. Field crews log harvesting, attendance, and inspections from mobile with offline sync; managers get dashboards, 17 operational reports, and weighbridge monitoring in a Next.js admin backed by a Go API.
- estate companies
- 8
- countries
- 4
- report types
- 17
- Role
- Tech lead, team of one or two
- Built at
- Amphibia Digital
- Platforms
- Web admin, mobile field app
- Stack
- Next.js
- Go
- SQL Server
- gRPC
- Mapbox
- Docker
- Grafana
Overview
Estate operations ran on paper. Attendance was a muster sheet, harvest counts were written per gang and copied up later, and monthly reports were compiled by hand. The platform replaces that with one flow from the block face to the monthly report.
Gang leaders capture harvesting, upkeep, attendance, and inspection records on tablets, GPS-tagged and photo-verified, and the records sync through the Go API's mobile namespace when a connection returns. The IRGA Field+ web admin turns them into dashboards, printable reports, and payroll figures. Each estate has its own SQL Server database, and Grafana keeps the infrastructure, sync pipeline, and database visible in production.
What I built
- Offline-capable mobile capture for field crews: GPS-tagged, photo-verified attendance, harvest, and daily-rate records that sync when back online.
- Harvest work orders count ripe, under-ripe, over-ripe, and rotten bunches plus loose fruit per block, feeding production reports with no manual compilation.
- Dashboards for daily and monthly FFB production, harvesting trends, rainfall and temperature, and block-level breakdowns, plus a map of field activity.
- Weighbridge monitoring for incoming and outgoing tonnage, trip counts, variance, and product mix across estates.
- Estate-scoped sign-in, one SQL Server database per estate, and printable monthly, overtime, and payroll reports straight from field data.
- Production observability in Grafana: infrastructure, database, mobile sync health, estate KPIs, and RED metrics for the API.
Screens
22 captioned views. Select any to enlarge.
Public site & sign-in
2 views
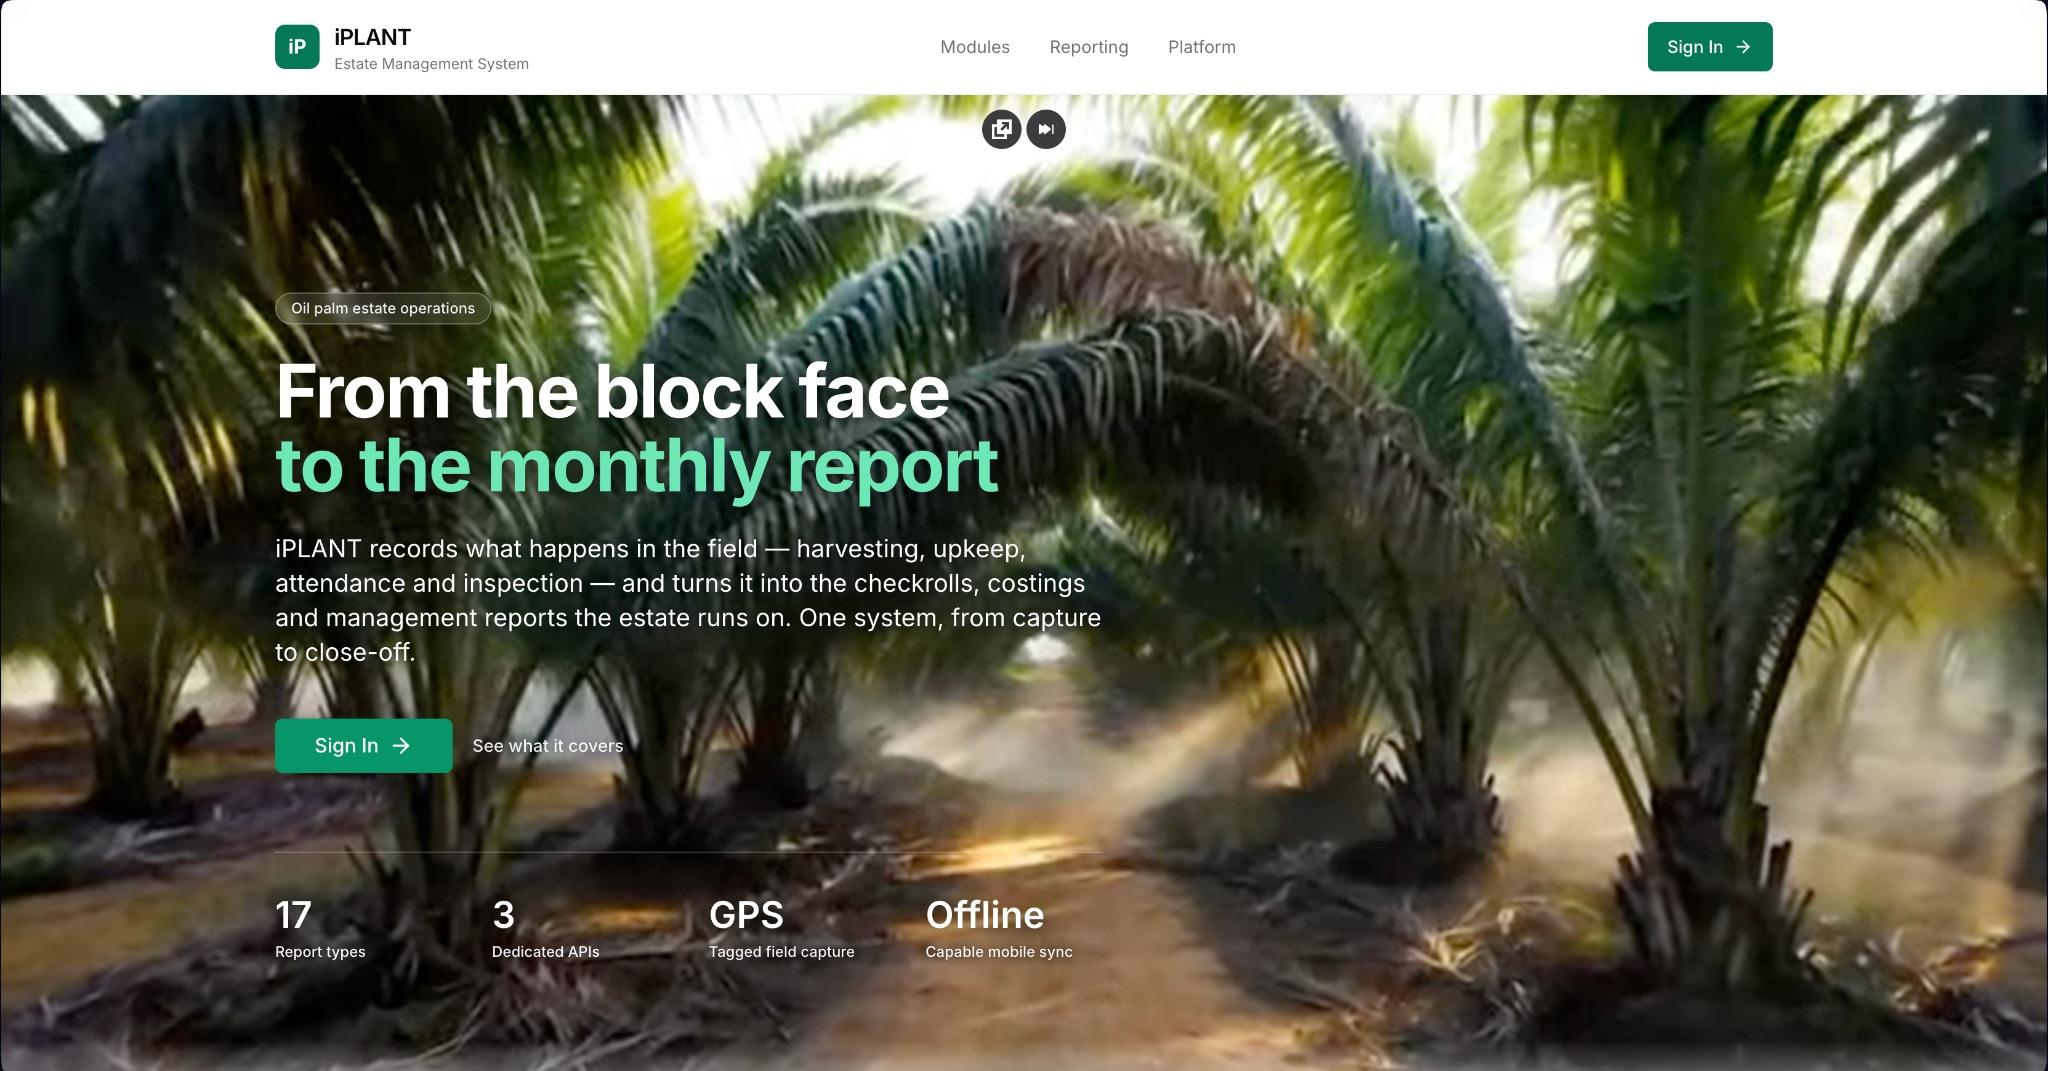
01Landing page
The iPLANT public homepage. Field data (harvesting, upkeep, attendance, inspection) turned into management reports.
02Estate sign-in
Users pick their estate before logging in, so one account can work across multiple estates.
Dashboards & map
3 views
03Dashboard: field production
Daily and monthly harvest production (FFB count and estimated tonnage), a rainfall/temperature chart, and a block-level harvesting breakdown.
04Dashboard: harvesting trends
Monthly and year-to-date bunches and tonnage, to spot trends across the season.
05Map
Field operations on a map, filtered by operation type and date range.
Field records
8 views
06Attendance
Daily attendance per employee with gang, job, assigned block, and present/absent status. This replaced the paper muster sheet.
07Edit attendance
Job description, assigned block, GPS geolocation, and photo verification for each worker.
08Harvest work orders
Daily harvest records per gang, employee, and block, with bunch counts and photo evidence for every entry.
09Edit harvest work order
Ripe, under-ripe, over-ripe, and rotten bunch counts plus loose fruit per block. Production reports are built from these entries.
10Daily-rate work orders
Fixed-rate work such as weeding and pruning by block, gang, and employee, with mandays for payroll and productivity tracking.
11Edit daily-rate work order
Job description, mandays, GPS location, and remarks. These entries feed payroll.
12Weather logs
Daily rainfall and temperature per estate, feeding the dashboard weather chart and agronomic decisions.
13Edit weather log
Individual readings with a full audit history, for accuracy and traceability over time.
Weighbridge & reports
3 views
14Weighbridge dashboard
Incoming and outgoing tonnage across estates: trip counts, tonnage variance, and product breakdown (FFB, fertiliser, diesel).
15Harvest round monthly report
Per-block harvest activity across the round, printable and exportable, generated straight from field data.
16Overtime by employee
Overtime mandays per employee over a custom date range, for faster payroll reconciliation.
Observability (Grafana)
6 views
17Infrastructure
CPU, memory, disk, and system load for the servers running iPLANT, in real time.
18Database overview
Table row counts and sizes across the system, with a built-in table browser for inspecting production records.
19Mobile API sync health
Offline-to-online sync from the field: syncs per hour (success vs failed), records saved vs skipped, and a failure log with error reasons.
20Estate operations
FFB bunches harvested, work orders, active blocks, harvesters working, and attendance trends across the estate.
21Service health (RED)
Rate, errors, and duration for the backend: availability, request rate by role and route, and latency percentiles.
22Database health
Connection usage, cache hit ratio, database size, transaction throughput, and lock contention under load.
Open to senior / lead roles · remote or relocating to Singapore
Hiring for a senior or lead role?
I take systems from requirements to production: mobile, web, backend, and AI agents. Tell me about the problem and I will reply within a day on weekdays.